3.1 Interface, Current Status, and Latest Event Log Information
This table displays the different interfaces of the Print Manager.
Interface: Contains links to pages that display statistics to profiled time and errors for the indicated interfaces.
Current Status: Indicates the state of each interface for the last hour.
Table 3-1 Interface Color Indicators
Latest Event Log: Displays the last 20 events for the given interface.
3.1.1 Client Interface
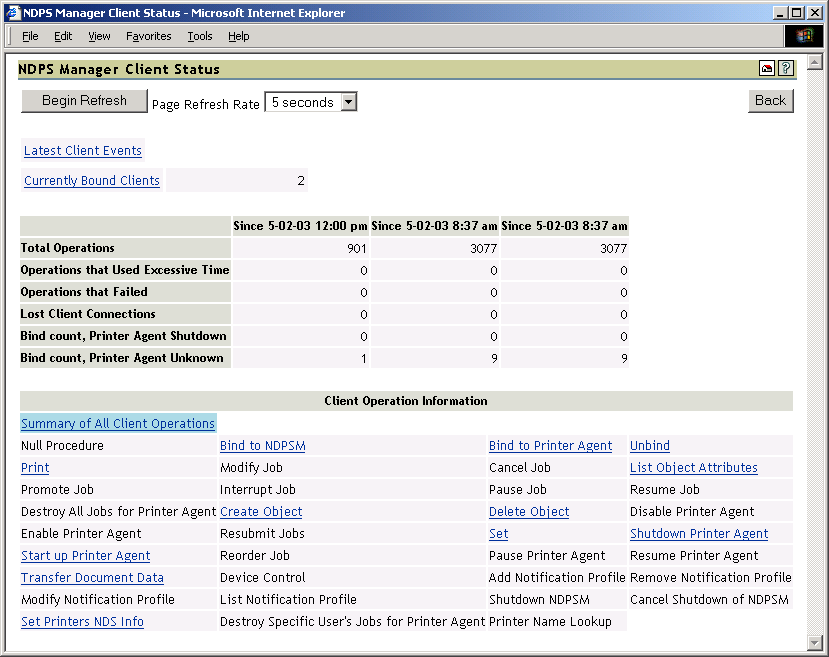
Figure 3-2 Client Interface Page
Begin Refresh Rate
Use the button to have the page refresh automatically at the indicated interval. To stop the page from being refreshed automatically, click the button again.
Latest Client Events
Displays the last 20 events for the given interface.
Currently Bound Clients
Displays statistics on clients currently bound to this Print Manager. Queues are listed first. Typically, most binds are transitory except for administrators that are using management tools.
Client Operations Statistics
Displays statistics regarding the operations that have occurred since the referenced time, typically in the last hour, since midnight, and since the Printer Agent was started.
Table 3-2 Client Operations
Client Operation Information
Lists all of the client operations that might occur with the Print Manager. These operations become selectable if any operation of that type has occurred. The statistics at the top of this page apply to the currently selected field.
When an operation event occurs, the operation is changed to a link. When you click a link, the statistics for that operation for the last hour are displayed above the Client Operation Information and the operation is highlighted with the color Cyan. The following are all the colors that can be used.
3.1.2 Gateway Interface
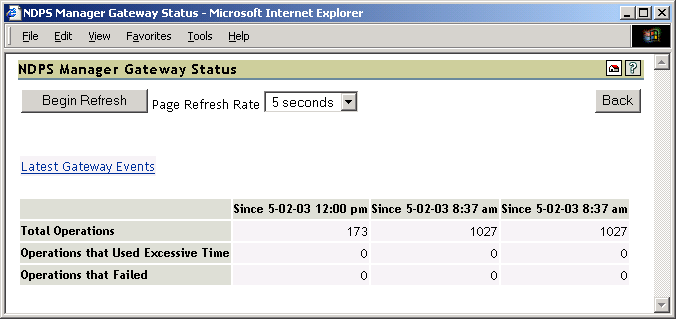
Figure 3-3 Gateway Interface Page
Begin Refresh Rate
Use the button to have the page refresh automatically at the indicated interval. To stop the page from being refreshed automatically, click the button again.
Latest Client Events
Displays the last 20 events for the given interface.
Gateway Operations
Displays statistics regarding the operations that have occurred since the referenced time, typically the last hour, since midnight, and since the Printer Agent was started.
3.1.3 Broker Interface
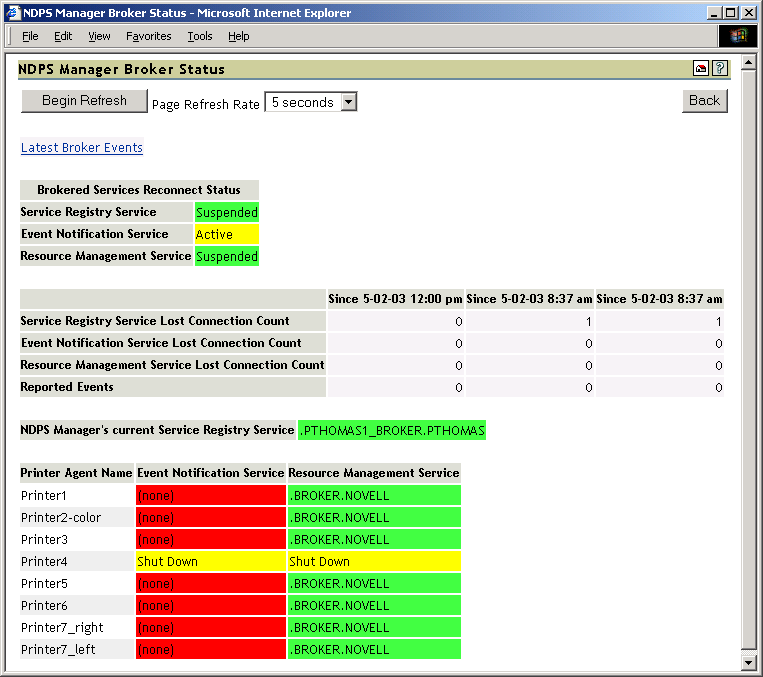
Figure 3-4 Broker Interface Page
Begin Refresh Rate
Use the button to have the page refresh automatically at the indicated interval. To stop the page from being refreshed automatically, click the button again.
Latest Broker Events
Displays the last 20 events for the given interface.
Brokered Services Reconnect Status
Lists the reconnect status for each brokered service.
Service Registry Service
Displays the broker currently being used by the Service Registry Service. Green indicates the service is up and running. Red indicates that the service is not.
Lost Connection Count Statistics
Show how many times the Print Manager has lost connection to each of the indicated servers.
Event Notification Service
Displays the number of events that have been reported by the Print Manager.
Printer Agent’s Event Notification and Resource Management Information
Displays the broker currently being used by the Event Notification Service and Resource Management Service for each of the associated Printer Agents.
Table 3-6 Broker Status Color Indicators
You can set the preferred server that the service is suppose to use in iManager. See Managing the Broker
in the iPrint Administration Guide.
3.1.4 Queue Interface
Use the Queue interface to view information when you Print Services is servicing a legacy queue.
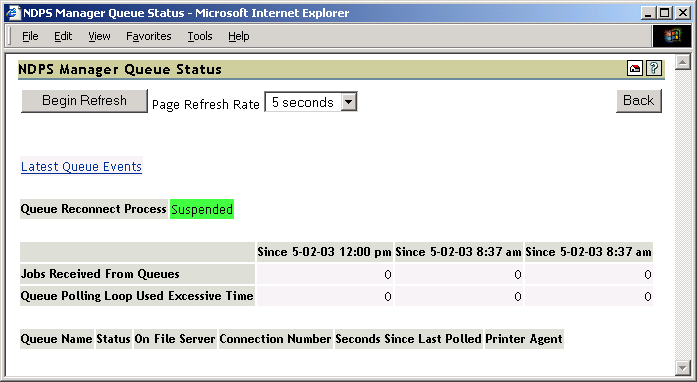
Figure 3-5 Queue Interface Page
Begin Refresh Rate
Use the button to have the page refresh automatically at the indicated interval. To stop the page from being refreshed automatically, click the button again.
Latest Queue Events
Displays the last 20 events for the given interface.
Queue Reconnect Process
Displays the status of the queue reconnect process.
Operations
Queue Information
The following sections explain the various queue information fields:
Queue Name: Links to the queue’s NDS information page. Access to this link is restricted to managers of this Print Manager object.
Status: Displays the queue’s status.
On File Server: Displays the name of the file server where the queue resides.
Connection Number: Displays the Print Manager’s connection number on the given file server.
Seconds Since Last Polled: Displays the number of seconds since the Print Manager last polled the given queue for a print job.
Printer Agent: Links to the Printer Agent Information page.
3.1.5 NDS Interface
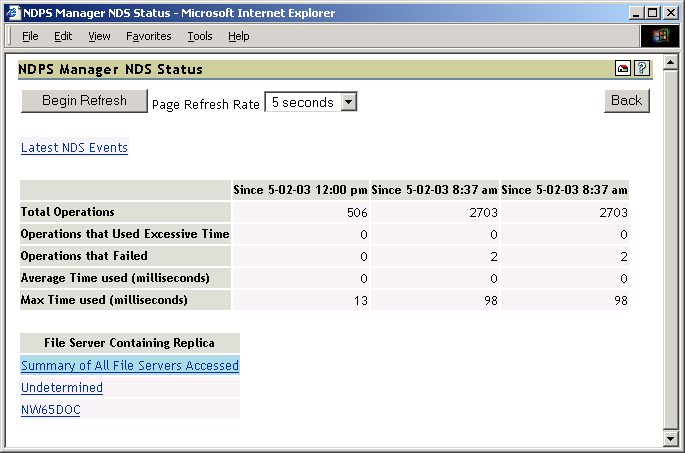
Figure 3-6 NDS Interface Page
Begin Refresh Rate
Use the button to have the page refresh automatically at the indicated interval. To stop the page from being refreshed automatically, click the button again.
Latest NDS Events
Displays the last 20 events for the given interface.
Operations
Table 3-7 NDS Operations
File Server Containing Replica
The statistics on this page apply to the currently selected replica in the list. The links are explained in the following table.
Table 3-8 NDS Replica Information
Clicking the link displays operations associated with that file server’s replica. The following colors are used.
Table 3-9 Operation Color Indicators
|
Color |
Description |
|---|---|
|
Cyan |
Currently selected event operation. |
|
Magenta |
Currently selected event operation with an event worthy of notice. |
|
Yellow |
An event worthy of notice has occurred. |
Last Access of Replica
If a file server has been selected under File Server Containing Replica, this displays the date and time that the Print Manager last accessed a replica on that file server.
Lost Connection Count
Displays the number of times the Print Manager eDirectory™.
3.1.6 NDPS Manager Internal
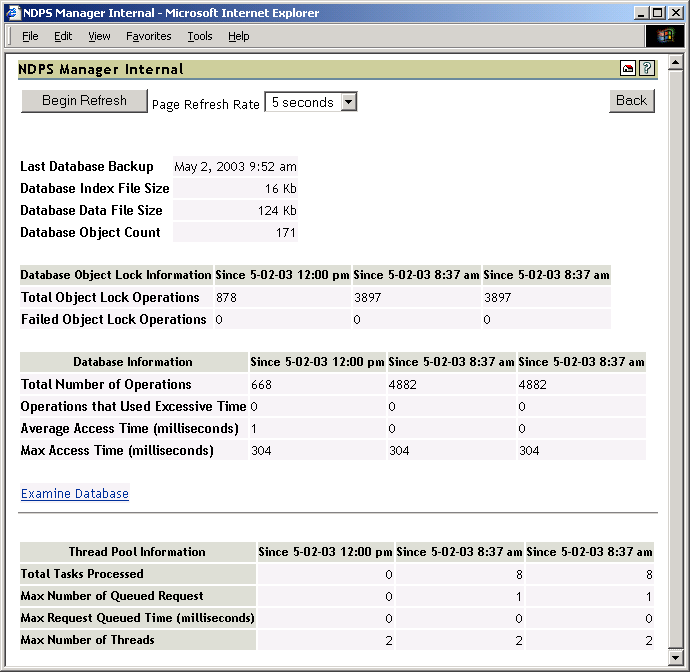
Figure 3-7 Print Manager Internal Page
Database Backup and File Size Information
Displays general information about the Print Manager’s database. The index file and the data file together comprise the Print Manager’s database. The index should be roughly one-tenth the size of the .
A large index file is indicative that a large number of database objects have been deleted. While this does not affect performance, you can resynchronize the database to update the index file size, if necessary.
Database Lock Operations
The Print Manager uses locks when accessing objects in its database. If the lock for an object cannot be acquired, the object cannot be accessed and that database operation fails. displays how many object lock operations have been attempted and how many have failed for the specified time.
Database Information
Displays statistics on the performance of the Print Manager’s database. Excessive time is defined as 10 seconds. The should be 0 (zero).
Statistics for the is expected, and most entries are associated with file system backups.
Examine Database
Links to a page that gives details about the database objects.
Thread Pool Information
The Print Manager has a thread pool that it uses to process a variety of tasks. This table displays some statistics to monitor the performance and load on this thread pool.