
  |
Use at the server console to
NOTE: The screen saver and the console-locking features have been removed from MONITOR and incorporated in the SCRSAVER utility.
[LOAD] [path] MONITOR
| Parameter | Use to |
|---|---|
path |
Specify the path leading to MONITOR if you copied it to a directory other than the default directory. |
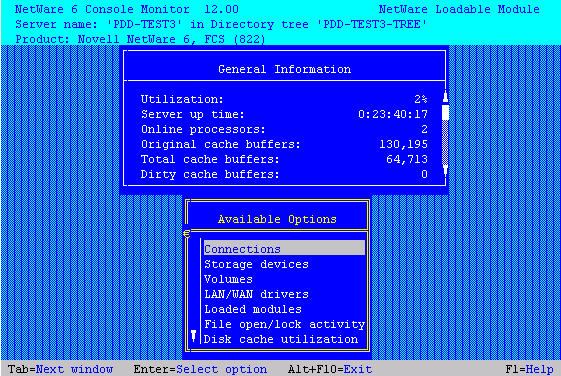
When MONITOR is first loaded, both the General Information window and the Available Options menu are displayed.

The Available Options menu allows you to access additional server information, statistics, and settings. At some windows, you can also perform operations.
The General Information window displays many of the key statistics that MONITOR reports.
The arrow to the left of the vertical line in the Available Options menu indicates that the menu can be scrolled.
HINT: For explanations of options on MONITOR menus as well as lists and statistics, you can press press F1 to access MONITOR's online help when you are running MONITOR at the server console.
You can press Tab to expand and activate any information window. You can press Tab again to toggle back to a list or menu. The active window is always highlighted in yellow.
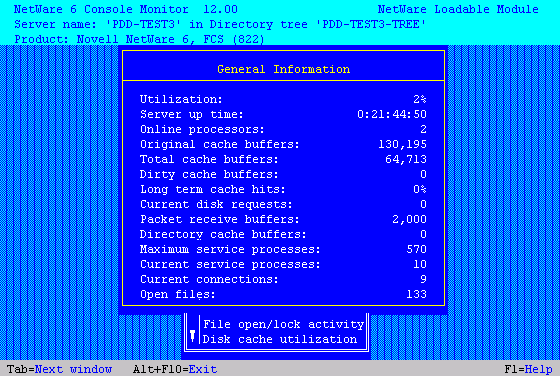
After a period of inactivity at the Available Options menu, the General Information screen expands by default to allow convenient monitoring of more critical statistics, as shown in the following figure.

The following table describes the fields of General Information.
| Field | Explanation |
|---|---|
Operating system version and date |
The version and release date of the system (upper- left corner of the screen). |
Server server name on network tree name |
The name of the server and the eDirectoryTM tree name. |
Utilization |
Average of the server's total processing capacity that was used during the last second (default update interval), expressed as a percentage. The remainder is spent in the idle loop process. On a uniprocessor server, this value reflects processor utilization. On a multiprocessor server, this value is the average utilization of all active processors. For utilization information about individual processors, select MONITOR Available Options > Kernel > Processors. This utilization value will reflect the changes in system configuration as they occur, such as an NLMTM program being loaded or unloaded, or a volume being mounted or dismounted. |
Server Up Time |
Time elapsed since the server was most recently started. This value is displayed in the format DD:HH:MM:SS (days:hours:minutes:seconds). Use this information to detect power failures or to determine whether an intruder brought down the server. |
Online Processors |
The number of enabled and active processors. |
Original Cache Buffers |
The original size of the cache buffer pool, which is the number of cache buffers available when the server is booted. All memory not used to load NetWare® (code plus loader) is assigned to the cache buffer pool. Memory is borrowed from this pool as needed. The default size of a cache buffer is a 4096-byte memory page. |
Total Cache Buffers |
The number of cache buffers currently available for file caching after allocating memory for NetWare. This number decreases as modules are loaded or memory is allocated in other ways. A minimum parameter controls when the server cannot continue to allocate file cache buffers. An alert can be set to report when the number of cache buffers approaches this limit. See SET "File Caching Parameters" on page 237 for a description of these parameters. You can set these parameter values in MONITOR Available Options > Server Parameters > File Caching Parameters. You can also use the SET utility. The Disk Cache Utilization option provides additional file cache buffer statistics for assessing RAM. |
Dirty Cache Buffers |
Number of cache buffers that contain updated data that has not yet been written to disk. The operating system writes the data to disk either as soon as the cache buffer is filled or else when the Dirty Disk Cache Delay Time elapses (default 3.3 seconds). The trade-off is between allowing small writes to wait the delay time or reducing the delay time and performing two writes. See Improving Disk Reads and Improving Disk Writes in the NetWare Server Disks and Storage Devices Guide. Also, see SET File Caching Parameters for the Traditional File System for description of the parameter that controls the delay time. If the number of dirty buffers is frequently above 50% of Total Cache Buffers, install more RAM for cache. A disk I/O bottleneck may be indicated if the number of dirty buffers remains constant and the number of Current Disk Requests remains high. Consider installing a faster hard disk and controller. |
Long Term Cache Hits |
Cumulative percentage of requests for disk blocks that were already in cache. Use this value to assess overall disk cache utilization. If this value falls below 90%, install more RAM for cache. Another field to check as you assess RAM is LRU Sitting Time. See Tuning File Cache in the Server Memory Administation Guide. |
Current Disk Requests |
Number of pending disk I/O requests that are queued for service. Use this value as a measure of the system load for the disk channel. If this number is consistently high, the disk and controller may be too slow. If the number of Dirty Cache Buffers exceeds 50% of Total Cache Buffers and server performance is slow, consider installing faster hard disks. |
Packet Receive Buffers |
Number of buffers that are available to the file system for holding client requests until they can be processed. Also referred to as communication buffers. The buffer size is fixed and is determined by the network board. The server allocates buffers as needed within minimum and maximum parameter values. For a description of these parameters, see SET Communications Parameters. You can set these parameter values in MONITOR Available Options > Server Parameters > Communications Parameters. You can also use the SET utility. |
Directory Cache Buffers |
The number of buffers available to the file system to cache the most frequently requested directory entries. The server allocates more directory cache buffers as needed within minimum and maximum parameter values. For a description of these parameters, see SET Directory Caching Parameters for the Traditional File System. You can set these parameter values in MONITOR Available Options > Server Parameters > Disk Caching Parameters. You can also use the SET utility. |
Maximum Service Processes |
Maximum number of processes (threads or task handlers) the system will allocate to service client NCPTM requests. The server creates more service processes as needed within minimum and maximum parameters. Once memory is allocated for service processes, it remains allocated even when no longer required. Each service process requires 4 KB of RAM. For a description of these parameters, see SET Miscellaneous Parameters. You can increase the value of Maximum Service Processes in MONITOR Available Options > Server Parameters > Miscellaneous Parameters. You can also use the SET utility. |
Current Service Processes |
Number of threads or task handlers that are currently allocated to service client NCP requests. As the number of client requests increases, the server creates more service processes within minimum and maximum parameters. As this value approaches the maximum number that can be created, server performance will be adversely affected. An alert appears when the maximum number is reached. For a description of these parameters, see SET Miscellaneous Parameters. You can increase the value of Maximum Service Processes in MONITOR Available Options > Server Parameters > Miscellaneous Parameters. You can also use the SET utility. |
Current Connections |
Number of current active connections. This includes both licensed and unlicensed connections. Both licensed and unlicensed connections are considered active connections. A license for a NetWare network permits a user to connect to as many servers in an eDirectory tree as needed. An unlicensed connection doesn't consume a license. Connection licenses are no longer managed at the server level. Under Novell Licensing Services (NLS), the licensable entity is a NetWare network connection rather than a server connection. See Understanding Novell Licensing Services in the Novell Licensing Services Administration Guide. You can view a list of active connections from MONITOR Available Options > Connections. All connections described as licensed or unlicensed, authenticated or Not Logged-In, are considered active connections and are tracked by the server |
Open Files |
Number of files currently being accessed by the server and by other clients. Certain files, such as the hidden files that support eDirectory, are always open. |
The following table explains what information can be accessed through MONITOR options.
| Menu Option | Use to |
|---|---|
Connections |
HINT: Press F3 to sort the items in the connection list. |
Storage Devices |
|
Volumes |
|
LAN/WAN Drivers |
For information on each LAN driver counter, see LAN Driver Statistics. |
Loaded Modules |
HINT: Press F3 to sort the modules by bytes of allocated memory or date of creation, in addition to name. |
File Open/Lock Activity |
|
Disk Cache Utilization |
HINT: For more information on these statistics, press F1 for help while in this screen. |
System Resources |
HINT: Press F3 for sort options for Resource Tags. |
Virtual Memory |
|
Kernel |
|
Server Parameters |
Set values for server parameters. This menu provides the same functionality as the SET command. For descriptions of parameter categories and individual parameters, see SET. |
For a description of the MONITOR Server Parameters, see the tables for each parameter category in SET.
  |