10.6 Viewing the Cluster Event Log in iManager
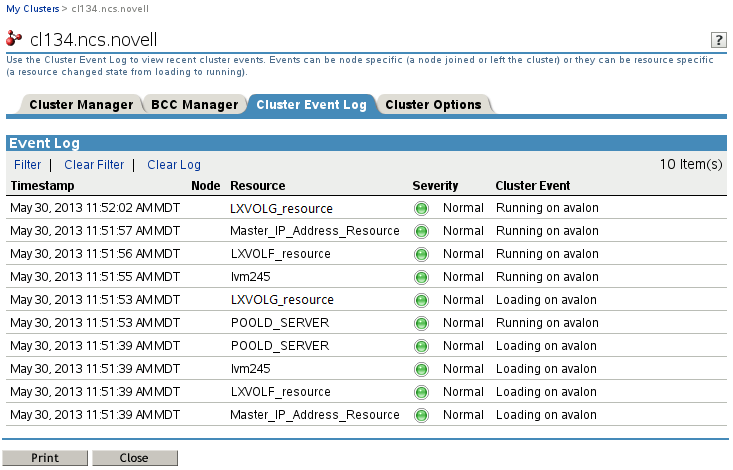
The Cluster Event Log in Clusters-plug for iManager lets you view recent cluster events logged in the /admin/Novell/Cluster/EventLog.xml file. Events can be node specific (a node joins the cluster or leaves the cluster) or they can be resource specific (a resource comes online or goes offline).
By default, the Cluster Event Log displays 10 most recent events (newest to oldest) for all severity levels, all nodes, and all resources. You can use the Cluster Event Log Filter page to filter out events that are not of interest so that only the desired log entries are displayed in the report. You can filter out events according to these categories:
-
Severity (Error, Normal, Warning)
-
Node (by node name)
-
Resource (by resource name)
Selecting a check box causes that entry type to appear in the log. Deselecting a check box filters out the associated entry type.
In the Event Log Range section of the filter, you can choose to report all events in the log, or you can get a report of logged events that occurred during a specified time range. The time range filter displays events that occurred during the interval of time before a specified date and time and after a specified date and time. For example, you might want to see events that occurred for a cluster resource before the date/time that a failover event was triggered and after the date/time of its previously known good state. By default, the After field displays the date and time of the most recent logged entry, and the Before field displays the date and time of the oldest available logged entry. The search includes the specified before and after date/time values. If you specify date/time values outside the range of entries that are available, the filter applies the default range.
In the Details section of the filter, you can control how many event log messages are displayed per page. The default is 10 events per page. If the number of entries for your search exceeds one page, you can click the right-arrow button and left-arrow button to page through the report. Click the double-left-arrow button to jump to the first page of the report. Click the double-right-arrow button to jump to the last page of the report.
In the Details section of the filter, you can also choose whether the log message portion of a log entry is displayed in the log.
To view the logged cluster events:
-
In iManager, select Clusters > My Clusters, then select the cluster.
-
Select the Cluster Event Log to view the latest cluster events.
Ten most recent events are displayed by default in reverse chronological order.

-
(Optional) Generate a custom event report.
-
At the top of the Cluster Event Log page, click Filter to open the Event Log Filter page.

-
In the Security section, deselect the check box next to message types that are not of interest.
-
Error
-
Normal
-
Warning
For example, deselect Normal to omit normal events. Only error and warning messages will appear in the report.
-
-
In the Node section, deselect the check box next to nodes that are not of interest. Only events for selected nodes will appear in the report.
-
In the Resource section, deselect the check box next to cluster resources that are not of interest. Only events for selected resources will appear in the report.
-
In the Event Log Range section, select one of the following:
-
Entire log
-
Time range (inclusive)
-
Before this date/time
-
After this date/time
-
-
-
In the Details section, specify how many messages to display per page and whether the log message portion of a log entry is displayed in the report.
-
Click OK to apply the filter.
-
View the custom report.
For example, the following report shoes only error or warning messages for the POOLD_SERVER cluster resource that appear in the entire log.

-
-
Click Clear Filter to clear the current filter.
-
(Optional) Click Clear Log to remove all entries from the log.
All prior log entries are deleted and are no longer available.