1.4 Understanding Analyzer’s User Interface
Analyzer delivers its functionality through a new perspective for Novell Designer for Identity Manager. Much of the user interface remains the same, but individual UI elements provide different features in the Analyzer perspective than in the standard Designer perspective. The primary Analyzer UI elements include the following:
1.4.1 Welcome View
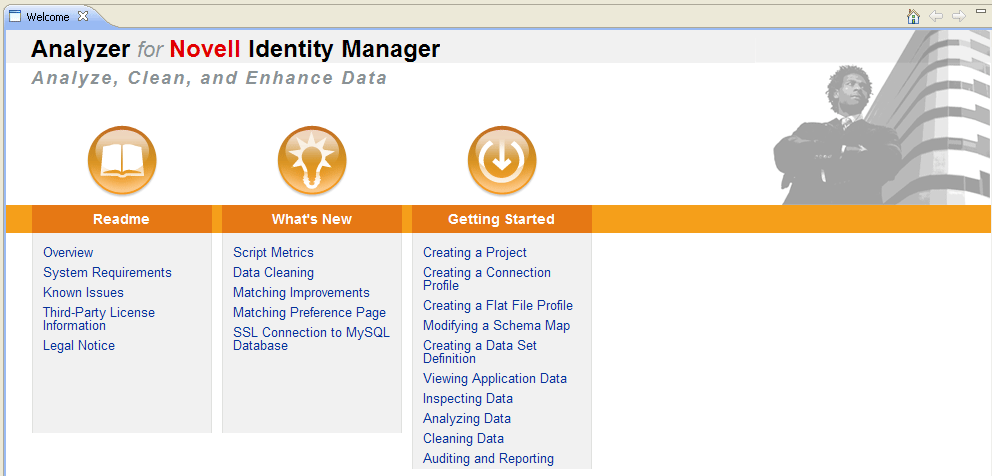
The Welcome view is essentially Analyzer’s title page. It provides version information and links to the Analyzer Readme and documentation.
Figure 1-2 Analyzer Welcome Page
1.4.2 Project View
The Project view displays the details of your current Analyzer projects. Analyzer actions create and manipulate the project components displayed in the Project view. The Project view includes a toolbar that you can use to work with your Analyzer project.
Figure 1-3 Analyzer Project View
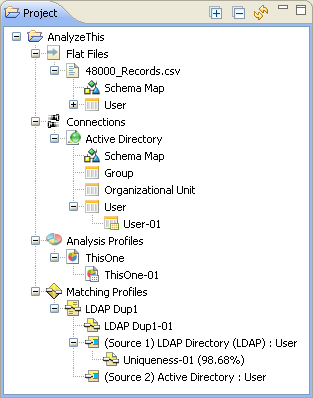
Table 1-1 Icons in the Project View
|
Icon |
Description |
|---|---|
|
|
The icon expands the object hierarchy in the Project view. |
|
|
The icon collapses the object hierarchy in the Project view. |
|
|
The icon refreshes the Project view and reinitializes Analyzer’s internal database. |
Additionally, you can right-click any object in the Project View for a menu of actions you can perform on the selected object.
The Project View uses several icons to represent the various objects you can create in an Analyzer project:
Table 1-2 Project View Icons
|
Icon |
Description |
|---|---|
|
|
Represents a specific project container. The project folder contains all objects related to a particular Analyzer project. |
|
|
Represents the flat file connection container, where you can create and manage flat file profiles. |
|
|
Represents a specific flat file connection. |
|
|
Represents a specific schema map for the associated application or flat file connection. |
|
|
Represents a specific data set definition. |
|
|
Represents a specific data set generated from the associated data set definition. If you make changes to data set instance values after importing the data set, Analyzer indicates this by displaying the icon. NOTE:Because managing modifications requires re-querying the database, the icon persists even if you reset all values to their original state. To reset the Modified Data Set flag in this case, click in the Data Browser toolbar. |
|
|
Represents the connection profile container, where you can create and manage connection profiles to different applications. |
|
|
Represents a specific application connection profile and identifies the associated driver as running or stopped. |
|
|
Represents the analysis profile container where you can create and manage analysis profiles. |
|
|
Represents a specific analysis profile. |
|
|
Represents specific analysis results, generated by applying the analysis profile to a specific data set instance. |
|
|
Represents the matching profile container, where you can create and manage matching profiles for data comparison. |
|
|
Represents a specific matching profile. |
|
|
Represents the results of a specific matching or uniqueness analysis, run against the data sets specified in the matching profile. |
|
|
Represents a specific data source configuration used in a matching profile. |
1.4.3 Schema Map Editor
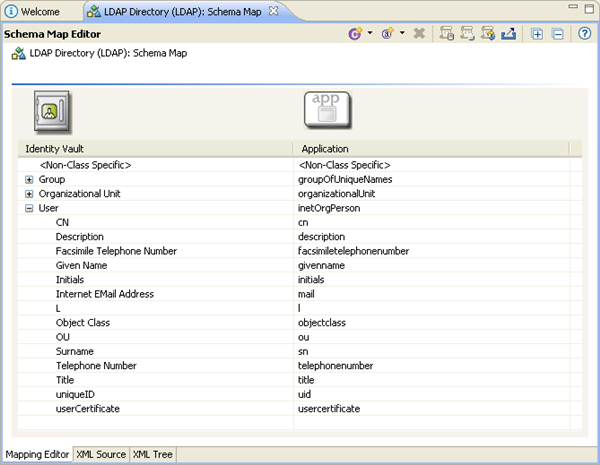
Analyzer’s schema map associates an application’s schema attributes to the corresponding schema attributes in Analyzer’s base schema. This lets you ensure that your data analysis and cleaning operations properly associate similar values between the disparate systems.
To accomplish this, Analyzer leverages the schema mapping features in Designer. For detailed information about mapping schema in Identity Manager, see Managing the Schema
in the Novell Designer 3.0 for Identity Manager 3.6 Administration Guide.
Figure 1-4 Schema Map Editor
The Schema Map editor includes a toolbar that you can use to work with schema:
Table 1-3 Icons in the Schema Map Editor
|
Icon |
Description |
|---|---|
|
|
The icon lets you define a mapping between an Identity Vault class and an application class. |
|
|
The icon lets you define a mapping between an Identity Vault attribute and an application attribute. |
|
|
The icon deletes the selected schema mapping entry in the Schema Map editor. |
|
|
The icon opens the Manage Schema dialog box, from which you can add, delete, and modify the object classes and attributes in the Identity Vault schema. |
|
|
The icon opens the Manage Schema dialog box, from which you can add, delete, and modify the object classes and attributes in the application schema. |
|
|
The icon lets you query the application for an updated schema definition. |
|
|
The icon expands the schema hierarchy in the Schema Map editor. |
|
|
The icon collapses the schema hierarchy in the Schema Map Editor. |
|
|
The icon lets you save the current schema mapping to an XML file. |
Additionally, you can right-click in the Schema Map editor for a menu of actions you can perform.
1.4.4 Data Browser
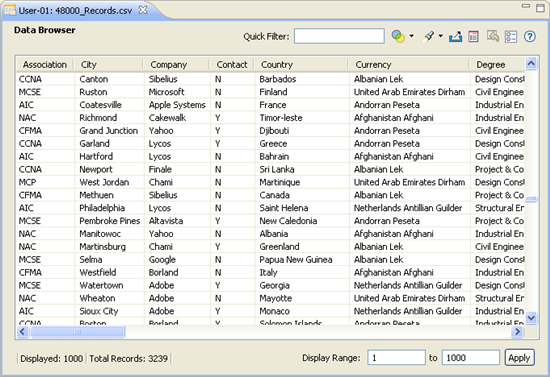
The Data Browser displays the details of the selected data set instance. From this view you can examine and modify the data in the data set instance. Click in the Data Browser to select a cell. After selecting a cell, you can navigate the Data Browser with your keyboard arrow keys.
Figure 1-5 Data Browser Editor
When using the Data Browser, you should be familiar with the following topics:
Data Browser Toolbar and Controls
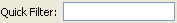
The Data Browser editor includes a toolbar and other controls that provide access to common Data Browser actions.
Table 1-4 Controls in the Data Browser Editor
|
Icon |
Description |
|---|---|
|
The field lets you specify a keyword filter for the fields in the current data set instance. The Data Browser displays only those records that contain the keyword in one or more of its cells. |
|
|
The icon lets you filter your view of the current data set instance. For more information, see Filtering Data. |
|
|
The icon opens the Inspect Data dialog box so you can test data in the Data Browser. For more information, see Section 3.7, Inspecting Data. |
|
|
The icon lets you export the current data set instance or generate a report based on the current contents of the Data Browser. For more information, see Section 3.6.2, Exporting Data and Section 3.11, Auditing and Reporting. |
|
|
The icon lets you create a report of the data currently displayed in the Data Browser, including any changes you might have made since importing the data set instance. For more information, see Section 3.11.2, Data Browser Reports. NOTE:The Data Browser reflects any query sort applied to the data set, but ignores any local sort settings in the Data Browser. |
|
|
The icon opens the Update to Application dialog box, where you can select the changes you want to write back to the application. Click to complete the data update process. |
|
|
The icon displays the Data Browser Display Settings page, where you can manage how the Data Browser editor displays data. For more information, see Section 2.5, Data Browser Settings. |
|
Query Sort |
Click any column header to sort the entire data set instance by that column. Click the column header once to sort in ascending order. Click the column header again to sort in descending order. The Data Browser displays a sort order icon in the column header that indicates the current sort order (ascending or descending). The query sort is case sensitive, meaning that it sorts 0-9, then A-Z, then a-z. IMPORTANT:If you query sort an attribute with multiple values, the same record might appear on multiple pages in the Data Browser. For example, when sorting on a Title attribute with multiple values in each record, the John record might appear on the first page with Title values A - G, then on a later page with Title values H - P, then again with Title values Q - Z. |
|
|
The Show icons let you select the types of records you want to display in the current page. Options include , , , and . NOTE:The Data Browser applies Show icons to each data page individually, rather than to the entire data set instance. This means that the number of pages in the data set instance doesn’t change, but the number of records displayed on a page might change considerably. |

|
The Paging icons let you navigate between the pages of data in the current data set instance. You can jump to the first or last page, and browse to the previous or next page of data. You can set the actual page size (number of records per page) in > , then select > in the left navigation area. |
Data Browser Right-Click Menu
You can right-click in the Data Browser to display a menu of actions you can perform.
Table 1-5 Data Browser Right-Click Menu Options
|
Menu Option |
Description |
|---|---|
|
Apply Metric to Column |
Applies the metric you select to the specified column. Analyzer evaluates each value in the column against the metric to see if it matches the metric format. |
|
Inspector |
Opens the Inspector dialog box so you can define metrics for the different attributes in your data set. For more information, see Section 3.7, Inspecting Data. |
|
Clear |
Allows you to clear currently applied filter or Inspector settings. |
|
Manage Metrics |
Opens the Metric Manager, where you can create, edit, and delete metrics, which allow you to test attributes for a specific data format. For more information, see Section 3.8.2, Analyzing a Data Set. |
|
Show Only |
Specifies the types of records you want to display in the current page. Options include , , , and . NOTE:The Data Browser applies restrictions to each data page individually, rather than to the entire data set instance. This means that the number of pages in the data set instance doesn’t change, but the number of records displayed on a page might change considerably. |
|
Show all Multi-values |
Enables displaying multiple values for those attributes that contain them. When this option is deselected, the Data Browser displays only the first attribute value. You can also modify this setting from the Display Settings dialog box. |
|
Sort Local Page |
Sorts the currently displayed page of data from the data set instance. To use this feature, right-click in the column on which you want to sort, then select to sort in ascending order. Repeat this process to sort in descending order. You can use the local sort and query sort together. The query sort orders the entire data set instance, while the local sort orders the current page of data. For example, if you query sort a data set instance by the Surname attribute, and local sort the current page by the Title attribute, then page through the resulting data, you might see Surnames starting with A-C in the first page (sorted by Title), surnames C-F in the second page (sorted by title), and so on. |
|
Add Value |
Adds a value to the selected cell. If a single-valued attribute already has a value, or is disabled and the attribute has a value, the option is disabled. |
|
Edit Value |
Edits the value in the selected cell. |
|
Delete Value |
Deletes the value in the selected cell. |
|
Revert Value |
Replaces a modified cell value with its original, unmodified value. |
|
Edit Multi-Values |
Opens the Edit Multi-Valued Cell dialog box so you can add, edit, or delete one or more of the attribute values. This option is only available when there are already two or more values in the selected attribute. |
|
Export |
Exports the data set definition to a flat file. For more information, see Section 3.6.2, Exporting Data. |
|
Update to Application |
Saves Data Browser updates to the source application. For more information, see Section 3.7.3, Modifying Data. |
The Data Browser also provides keyboard-based access to the right-click menu. Keyboard usage varies slightly between Windows and Linux platforms:
Windows: Press Alt+m to open the right-click menu. Press the first letter of any menu option to execute that option. If multiple menu options start with the same letter, press the letter multiple times to cycle through the menu options that start with that letter, then press Enter.
Linux: Press Alt+m to open the right-click menu. Use use the up-arrow and down-arrow keys to select the option you want to execute, then press Enter.
Data Markers
When viewing and modifying data, the Data Browser uses different markers to indicate the state of the value in a given cell:
Figure 1-6 Data Browser Editor Data Markers
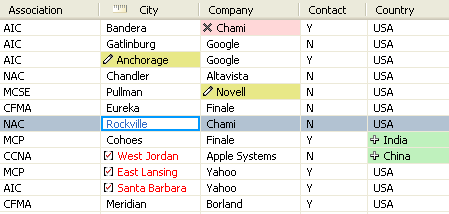
Selected Record: Identified with a gray background.
Selected Cell: Identified with blue text and border.
Modified Value: Identified with a yellow background and pencil icon.
Added Value: Identified with a green background and plus sign icon.
Deleted Value: Identified with a pink background and X icon.
Metric Applied:
![]() Indicates that a metric is applied to the column. This filters the Data Browser content based on that column.
Indicates that a metric is applied to the column. This filters the Data Browser content based on that column.
Failed Value: Identified with red text and a checkmark icon. This indicates that the value failed the metric applied to it.
1.4.5 Analysis Profile Editor
The Analysis Profile editor lets you configure a profile for analyzing one or more data set instances. Each analysis profile contains one or more metrics against which you can evaluate attribute values to see how the data conforms to your defined data format standards.
Figure 1-7 Analysis Profile Editor
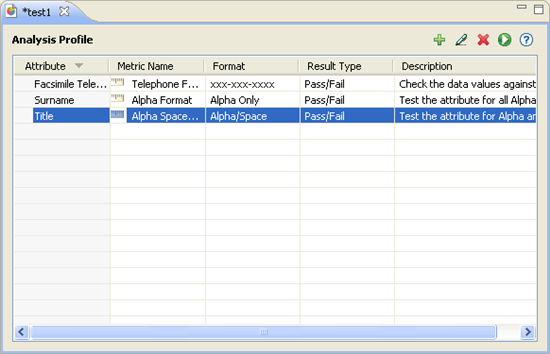
The Analysis Profile editor includes a toolbar that you can use to configure the analysis profile. You can also right-click in the Analysis Profile editor to access the same tools from a drop-down menu.
Table 1-6 Icons in the Analysis Profile Editor
|
Icon |
Description |
|---|---|
|
|
The icon opens the Analysis Metric Selector dialog box, where you can select an attribute/metric pair for your analysis. For more information, see Section 3.8.1, Creating and Customizing an Analysis Profile. |
|
|
The Edit icon lets you edit the currently selected metric in the Analysis Profile Editor. |
|
|
The icon removes the selected metric page from the current analysis profile. |
|
|
The icon performs an analysis (based on the analysis profile) against the selected data sets. For more information, see Section 3.8.2, Analyzing a Data Set. |
NOTE:To save changes to the Analysis Profile, use Ctrl+S or select Save ![]() from the Designer toolbar.
from the Designer toolbar.
1.4.6 Analysis Results View
The Analysis Results view displays the results of a data analysis performed against a particular data set instance. It displays each metric used to test the data set instance. Select an attribute to display details about the results of the analysis for that attribute.
Figure 1-8 Analysis Results View
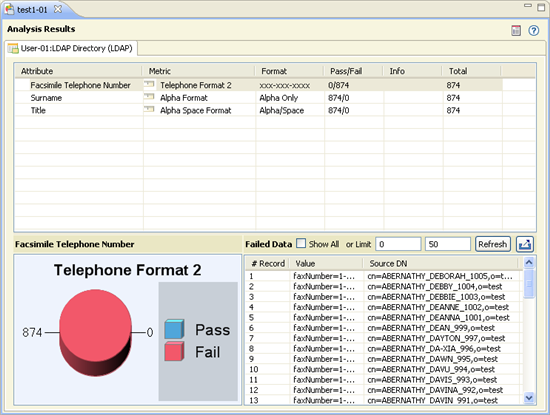
The Analysis Results view includes the following tools:
Table 1-7 Icons in the Analysis Results View
|
Icon |
Description |
|---|---|
|
|
The icon creates a report of the current analysis results. For more information, see Section 3.11.3, Analysis Reports. |
|
|
The icon lets you export the failed data to a delimited file for further analysis. You can also right-click a metric and select . For information about the Export to File dialog box, see Section 3.6.2, Exporting Data. |
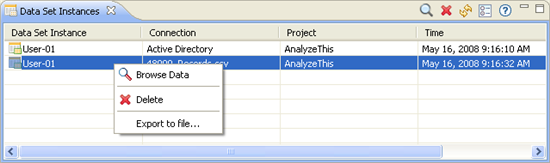
1.4.7 Data Set Instances View
The Data Set Instances view displays the current data set instances you have created in Analyzer. From this view, you can select a particular data set instance to browse, inspect, and analyze.
By default, Analyzer does not display the Data Set Instances view. To open it, select > > .
Figure 1-9 Data Set Instances View
The Data Set Instances view includes a toolbar that you can use to work with the data set instances you have created:
Table 1-8 Icons in the Data Set Instances View
|
Icon |
Description |
|---|---|
|
|
The icon opens the Data Browser for the selected data set. For more information, see Section 3.6, Viewing Application Data. |
|
|
The icon deletes the currently selected data set. |
|
|
The icon updates the data set information displayed in the Data Set Instances view. |
|
|
The icon opens the Preferences dialog box, from which you can configure Analyzer’s database settings. For more information, see Section 2.1.4, Database Settings. |
Additionally, you can right-click an entry in the data set instances view for a menu of actions you can perform. This menu includes and from Table 1-8, as well as an option to export the selected data set instance to a file.
1.4.8 Analysis Result Sets View
The Analysis Result Sets view displays the current analysis results sets you have generated in Analyzer. From this view, you can select a particular analysis results set to browse inspect, and analyze.
By default, Analyzer does not display the Analysis Result Sets view. To open it, select > > .
Figure 1-10 Analysis Result Sets View

The Analysis Result Sets view includes a toolbar that you can use to work with the trace data:
Table 1-9 Icons in the Analysis Result Sets View
|
Icon |
Description |
|---|---|
|
|
The icon opens the Analysis Results view for the selected Analysis. For more information, see Section 3.8.2, Analyzing a Data Set. |
|
|
The icon deletes the currently selected analysis. |
|
|
The icon updates the analysis results information displayed in the Analysis Results view. |
|
|
The icon opens the Preferences dialog box, where you can configure Analyzer’s database. For more information, see Section 2.1.4, Database Settings. |
Additionally, you can right-click a result set for a menu of actions you can perform.
1.4.9 Matching Profile Editor
The Matching Profile editor lets you compare values in one or more data sets. You can check for duplicate values within a specified data set and check for matching values between two data sets.
Figure 1-11 Matching Profile Editor

The Matching Profile editor includes a toolbar with the following tools:
Table 1-10 Icons in the Matching Profile Editor
|
Icon |
Description |
|---|---|
|
|
The Uniqueness Test icon lets you test the matching key with the selected data set definition to make sure it is suitable for use in match testing. For more information about uniqueness testing, see Section 3.10.1, Evaluating a Data Set for Unique Values. |
|
|
The icon starts the matching value analysis between two data sets. For more information about using the Matching Profile editor, see Section 3.10, Comparing Data. |
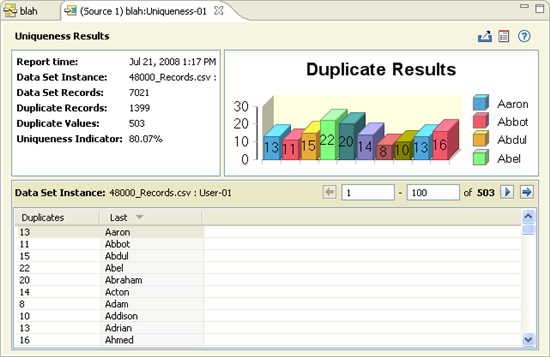
1.4.10 Uniqueness Results View
The Uniqueness Results view displays the results of a uniqueness test. It provides details about the analysis configuration, a graphical view of the results, and a list of duplicate values encountered during the analysis.
For more information about the uniqueness test, see Section 3.10.1, Evaluating a Data Set for Unique Values.
Figure 1-12 Duplicates Results View
The Duplicate Results view editor includes a toolbar with the following tools:
Table 1-11 Icons in the Duplicate Results View
|
Icon |
Description |
|---|---|
|
|
The icon lets you export the records with duplicate values to a flat file for further analysis. |
|
|
The icon lets you create a report of the analysis results. |
1.4.11 Matching Results View
The Matching Results view displays the results of your matching values analysis. It provides details about the analysis configuration, a graphical view of the results, and a list of matching values encountered during the analysis.
For more information about testing for matching values, see Section 3.10.2, Matching Values between Data Sets.
Figure 1-13 Matching Results View

The Matching Results view editor includes a toolbar with the following tools:
Table 1-12 Icons in the Matching Results View
|
Icon |
Description |
|---|---|
|
|
The icon lets you export the unmatched records to a flat file for further analysis. |
|
|
The icon lets you create a report of the analysis results. |
1.4.12 IDS Trace View
The Independent Driver Services (IDS) Trace view displays the communications between Analyzer and the selected application. This view is available primarily for troubleshooting connection problems when configuring and accessing data sets.
By default, Analyzer does not display the IDS Trace view. To open it, select > > .
The IDS Trace view includes a toolbar that you can use to work with the trace data:
Table 1-13 Icons in the IDS Trace View
|
Icon |
Description |
|---|---|
|
|
The icon lets you export the IDS trace data into an external text file so you can evaluate it offline. |
|
|
The icon lets you clear the current IDS trace log. |
|
|
The icon opens the IDS trace settings page, where you can configure the IDS trace environment. For more information, see Section 2.6, IDS Trace Settings. |