71.1 Using the Windows Monitor Agent Server Console
Initially, the Windows Monitor Agent server console lists all monitored GroupWise agents, along with their statuses.
NOTE:On Windows, agents and agent groups are displayed at the Monitor Agent server console. On Linux, similar functionality is available at the Monitor Agent Web console.
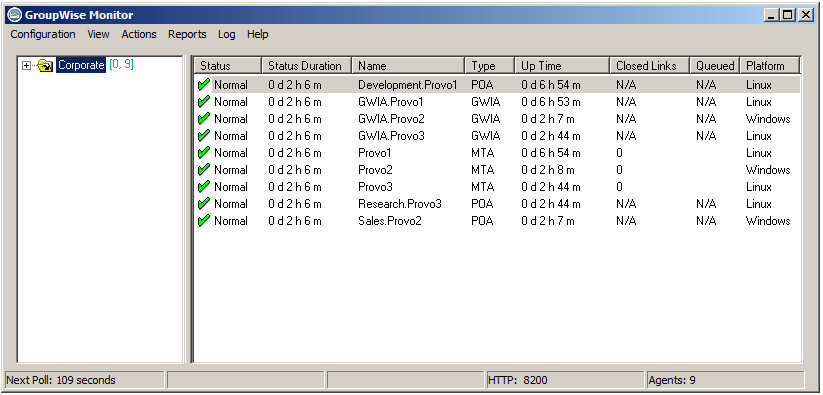
After you create agent groups, as described in Section 69.2, Creating and Managing Agent Groups, the agents in each group are displayed when you select a group.
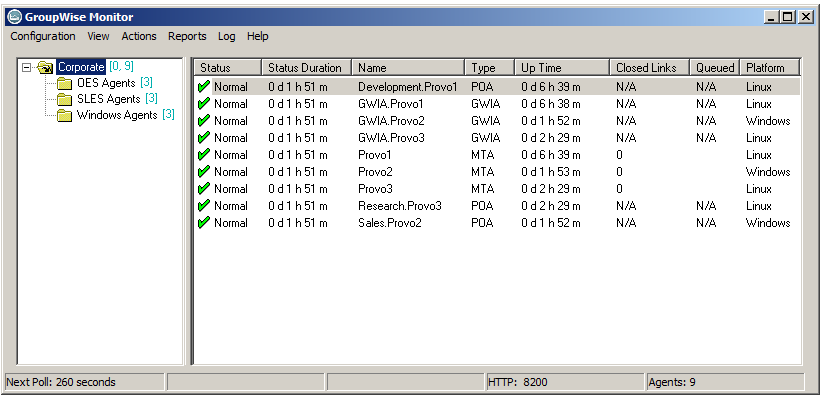
You can display many types of monitoring information at the Windows Monitor Agent server console.
71.1.1 Viewing All Agents
After you have separated your agents into groups, you can still view all agents in your GroupWise system in a single list.
-
On Windows, at the Monitor Agent server console, right-click the root agent group, then click .

or
On Linux, at the Monitor Agent Web console, click the root agent group, then click .
You can use the feature on any group that contains nested subgroups.
71.1.2 Viewing Problem Agents
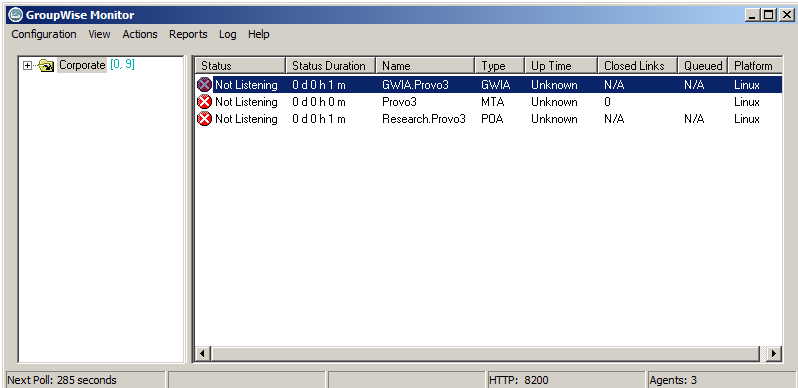
In a single agent group or in a group with subgroups shown, you can filter the list to show only those agents whose status is not Normal.
-
On Windows, at the Monitor Agent server console, click > .
or
On Linux, at the Monitor Agent Web console, click .
Only problem agents are now displayed. If you leave the Monitor Agent with only problem agents displayed, many groups might appear empty because all agents have a status of .
-
On Windows, to view all monitored agents again, click .
or
On Linux, click .
71.1.3 Viewing a Windows Agent Server Console
An active agent server console displays on each server where a Windows GroupWise agent is running. You can display a similar agent server console from the Windows Monitor Agent server console.
NOTE:This feature is not available on Linux.
-
Right-click an agent, then click .
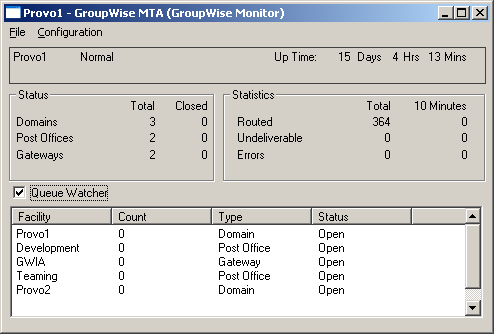
You cannot control the agent from the Monitor Agent as you can at the actual agent server console, but you can gather status information about the monitored agent.
71.1.4 Viewing an Agent Web Console
An agent Web console can be displayed anywhere you have access to a Web browser and the Internet.
-
On Windows, at the Monitor Agent server console, right-click an agent, then click .
or
On Linux, at the Monitor Agent server console, click the domain or post office link.
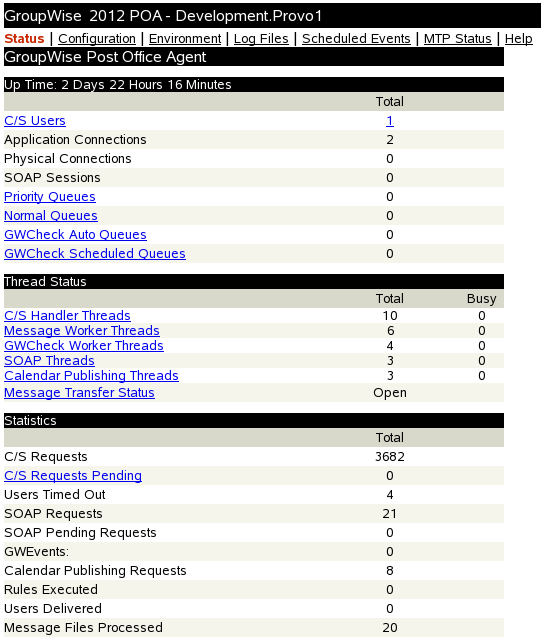
For information about the agent Web consoles, see the GroupWise agent documentation:
71.1.5 Polling the Agents for Updated Status Information
By default, the Monitor Agent polls the monitored agents every five minutes. You can change the default poll cycle, as described in Section 69.4, Configuring Polling of Monitored Agents. The time remaining until the next poll cycle is displayed in the lower left corner of the Monitor Agent server console.
You can also manually poll monitored agents.
On Windows, at the Monitor Agent server console:
-
To poll all agents, click > .
-
To poll a specific agent, right-click the agent, then click .
-
To stop polling a specific agent (for example, because the server it runs on is awaiting repairs), right-click the agent, then click You can specify a time interval for the agent to be suspended, after which polling resumes automatically. By suspending polling, you prevent repeat notifications for a problem that is already being addressed.
The suspended agent’s status is listed as , accompanied by the same icon used for the Unknown status
 .
.
-
To restart regular polling of an agent for which polling was suspended, right-click the agent, then click .
On Linux, at the Monitor Agent server console:
-
To poll all agents, select all agents, then click .
-
To poll a specific agent, select the agent, then click .
-
To stop polling a specific agent, select the agent, then click You can specify a time interval for the agent to be suspended, after which polling resumes automatically. By suspending polling, you prevent repeat notifications for a problem that is already being addressed.
The suspended agent’s status is listed as , accompanied by the same icon used for the Unknown status
 .
.
-
To restart regular polling of an agent for which polling was suspended, select the agent, then click .