71.2 Using the Monitor Web Console
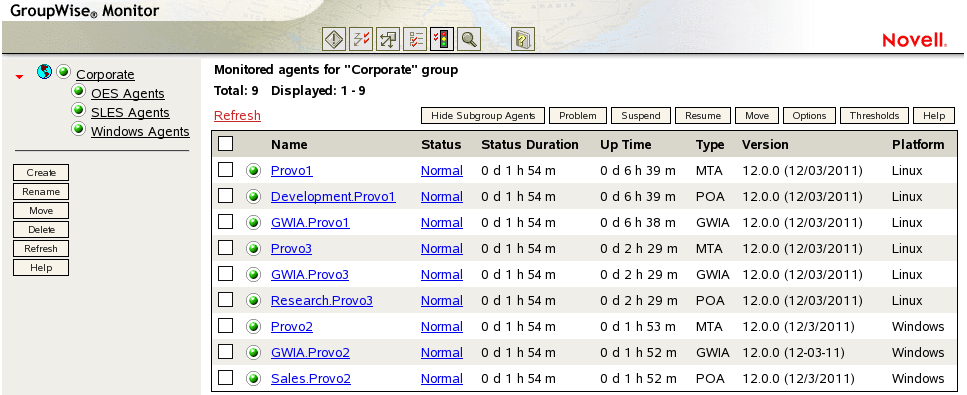
The Monitor Web console lists all GroupWise agents that the Monitor agent is polling for status information. Use the following URL to access the Monitor Web console:
http://web_server_address/gwmon/gwmonitor
where web_server_address represents the IP address or hostname of the Web server where the Monitor Application is installed.

Global features of the Monitor Web console are available on icon buttons at the top of the Monitor page.
|
Icon Button |
Feature |
|---|---|
|
|
Problem |
|
|
Link Trace |
|
|
Link Configuration |
|
|
Global Options |
|
|
States |
|
|
Search |
Click the icon button to display only agents in your GroupWise system whose status is other than . Click the name of your GroupWise system to display all agents again.
Click the status of an agent in the column to display agent status details.
Click an agent in the column to open its agent Web console. For information about the agent Web consoles, see Section 71.1.4, Viewing an Agent Web Console.
Click an agent group in the left panel to display all monitored agents in the group. Click the button above the agent list to display only those agents whose status is other than in the agent group. The button then changes to . Click the button to include working agents as well as problem agents in the list.
Click to update the agent status information. To modify the default poll cycle, see Section 69.4, Configuring Polling of Monitored Agents.
To see what specific tasks can be performed at the Monitor Web console, see Section 72.0, Comparing the Monitor Consoles.


