Left Panel

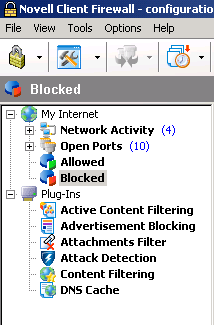
The Left panel and Information panel are similar to the left and right panels of Windows* Explorer. The Left panel is a listing of the components secured by NCF on your computer and the Information panel gives specific data about any component selected in the Left panel.
Figure 3
Left Panel
Network Activity ---Lists every application and protocol that currently has an active connection to the Internet or LAN as well as other network activity.
Allowed---Shows the event log stats for all the applications and connections that NCF allowed. You can view the stats filtered for the current session, current day, or all times.
Blocked ---Shows the event log stats for all the applications and connections that NCF blocked. You can view the stats filtered for the current session, current day, or all times.
Reported ---Is the event log of all the attempts by applications and connections to access the Internet or LAN that you specified NCF should report to you.
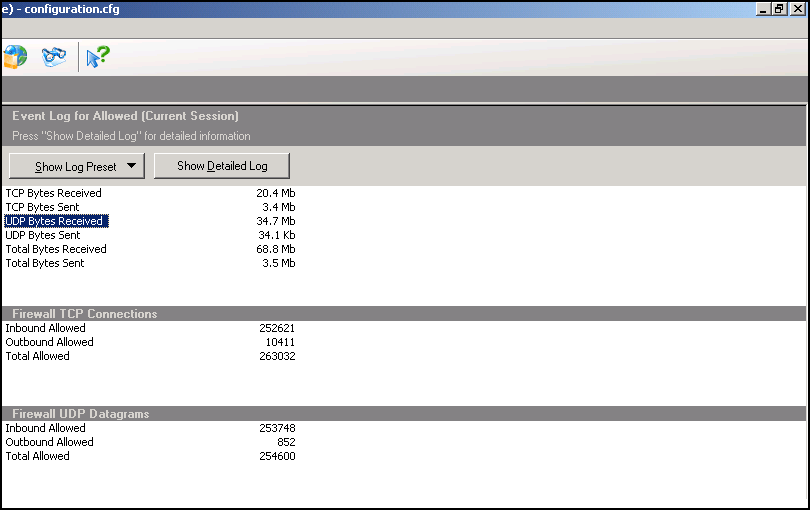
Although the details of the logs are intended for advanced users, the above items are important when you need to see the statistics on established connections or bytes sent and received. To view the logs in more detail, click the Show Detailed Log button located on the Information Panel of Allowed, Blocked, and Reported items. (For more details, refer to The NCF Log System.) You can also use these lists to make certain that NCF is correctly configured and is doing the job you need and want.
Plug-ins are independent from the primary NCF engine and you can install or uninstall any or all of them. You can even get third-party plug-ins from other developers and Web sites. (For more details, refer to Plug-Ins.)
Each plug-in has its own icon in the Left panel and the log of its activity is displayed in the Information panel. When NCF is first installed, the Plug-Ins list contains the following modules:
Active Content---Displays the event log of the sites that had some of their active content blocked based on the settings for Java, VB Script, Active X*, and other active content elements.
Ads---Displays the event log of all the ads that were blocked.
Attachments Filter ---Displays the event log of all the e-mail file attachments that were neutralized and quarantined from your computer.
Attack Detection ---Displays the event log of any suspected attacks on your computer from the Internet, the ports involved, and where the attacks are from.
Content---Displays the event log of all the Web sites or pages that were blocked and the reason for it.
DNS Cache ---Displays the event log of the Web addresses cached by NCF to speed up your Internet connection to those sites.
Each of the components is preceded by a plus sign (+) except the one selected, which has a minus sign (-) and is expanded to show its individual data. To hide this extra data, click the category's minus sign. A component without a plus or minus sign preceding it has no extra data to be shown or hidden.
The following figure is an example of the Information panel and some of the data it displays:
Figure 4
Information Panel
For information about customizing the Information panel, see Columns.
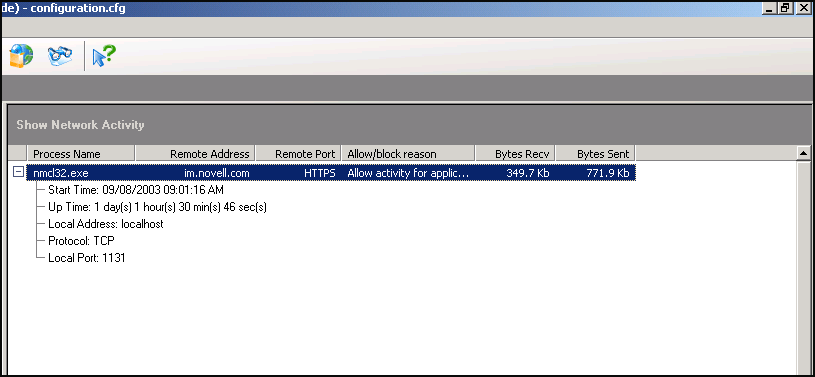
As with most elements of NCF, a right-click in the Information panel produces a context-sensitive menu. In the figure below, the menu is pertinent to the selected line. If no line is selected and the right-click is made over some of the white space below the lines, then none of the menu items is applicable and so all are grayed out.
Figure 5
Right-click in the Information Panel
The Welcome screen of NCF is displayed in the Information panel if you select My Internet in the Left panel. You can directly access the Application and System settings, Plug-ins, Log Viewer, and Help from this screen. For this, click the required feature from the list on the right-hand side of the screen.