33.2 Monitoring Access Gateway Statistics
Access Gateway statistics are available for each Access Gateway and for clusters:
33.2.1 Viewing Access Gateway Statistics
The Statistics page allows you to monitor the amount of data and the type of data the Access Gateway is processing.
-
In the Administration Console, click > > > .

-
Select from the following types:
-
Server SSL Activity (NetWare only)
-
Top 20 Sites (NetWare only)
-
Configured Services (NetWare only)
-
Click .
Server Activity
> >
Select whether to monitor live or static statistics:
Statistics: Select this option to view the statistics as currently gathered. The page is static and the statistics are not updated until you click .
Live Statistics Monitoring: Select this option to view the statistics as currently gathered and to have them refreshed at the rate specified in the field.
These general statistics are grouped into the following categories:
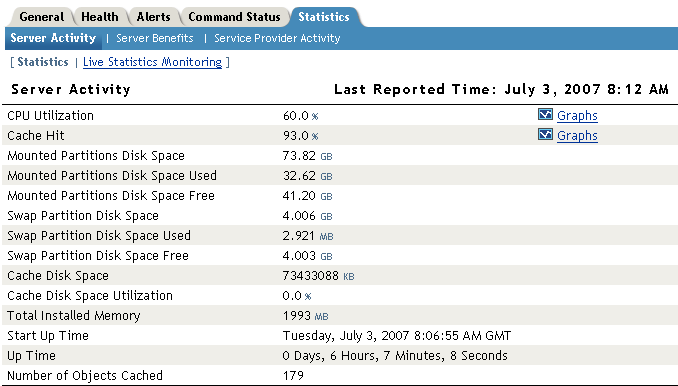
Server Activity
The Server Activity section displays general server utilization statistics.
Table 33-1 Server Activity
Connections
The connection statistics show the current and peak levels of usage in terms of TCP connections.
Table 33-2 Connections
Bytes
The bytes statistics show how fast information is being sent in response to the following types of requests:
-
Browser requests to the Access Gateway
-
Access Gateway requests to the Web servers
Table 33-3 Bytes
Requests
The request statistics show the number of requests that are being sent from the browsers to the Access Gateway and from the Access Gateway to the Web servers.
Table 33-4 Requests
Cache Freshness
The cache freshness statistics display information about the cache refresh process.
Table 33-5 Cache Freshness
Server Benefits
Select whether to monitor live or static statistics:
Statistics: Select this option to view the statistics as currently gathered. The page is static and the statistics are not updated until you click .
Live Statistics Monitoring: Select this option to view the statistics as currently gathered and to have them refreshed at the rate specified in the field.
The Server Benefits page displays information about bandwidth and DNS caching:
Table 33-6 Server Benefits
Server SSL Activity
(NetWare only) Select whether to monitor live or static statistics:
Statistics: Select this option to view the statistics as currently gathered. The page is static and the statistics are not updated until you click .
Live Statistics Monitoring: Select this option to view the statistics as currently gathered and to have them refreshed at the rate specified in the field.
The Server SSL Activity page displays information about the SSL communication process between the browsers and the Access Gateway and between the Access Gateway and the Web servers.
Table 33-7 Server SSL Activity
Top 20 Sites
(NetWare only) Select whether to monitor live or static statistics:
Statistics: Select this option to view the statistics as currently gathered. The page is static and the statistics are not updated until you click .
Live Statistics Monitoring: Select this option to view the statistics as currently gathered and to have them refreshed at the rate specified in the field.
The Top 20 Sites page displays the DNS name or IP address of the sites that are receiving the most traffic. These sites are sorted by the number of hits they received and by the number of bytes of data they sent.
Service Provider Activity
Select whether to monitor live or static statistics:
Statistics: Select this option to view the statistics as currently gathered. The page is static and the statistics are not updated until you click .
Live Statistics Monitoring: Select this option to view the statistics as currently gathered and to have them refreshed at the rate specified in the field.
The ESP Activity page displays information about the communication process between the Access Gateway module (ESP) and the Identity Server. These statistics are grouped into the following categories:
Cluster Proxy Statistics
Identity Federation Framework Statistics
Identity Provider Statistics
SAML Statistics
|
Statistic |
Description |
|---|---|
|
Number of SAML requests |
The total number of SAML1.1 query attribute requests that the Identity Server has processed. |
SAML 2 Statistics
Web Service Framework Statistics
Configured Services
(NetWare only) The Configured Services page displays information about all the services that have been configured on the selected Access Gateway. It includes information about the proxy services that you have configured as well as the system proxy services (the nesp and soapbc path-based proxy services).
33.2.2 Viewing Cluster Statistics
To view general performance statistics of the servers assigned to the selected cluster:
-
In the Administration Console, click > > > .
-
To determine performance, analyze the following statistics:
Column
Description
Server Name
Lists the name of the Access Gateways that belong to the group. To view additional statistical information about a specific Access Gateway, click the name of an Access Gateway.
CPU %
Displays the current CPU utilization rate. Use this statistic for capacity planning.
Cache Hit Rate %
Displays the current cache hit rate. A high cache hit rate indicates that the caching system is off-loading significant request processing from the Web server whose objects have been cached. If the percentage is low, you might want to configure a pin list. For this and other caching options, see Section 16.0, Configuring the Cache Settings.
Bytes per second to/from Server
Displays the rate at which the Access Gateway is requesting Web objects from the Web servers it is protecting.
Bytes per second to/from Browser
Displays the rate at which browser clients are requesting Web objects.
Current Connections
Displays the total number of TCP™ connections that are active, idle, or closing.
Statistics
Allows you to view all the statistics for a selected server. Click to see these additional statistics. For more information, see Section 33.2, Monitoring Access Gateway Statistics.
-
Click .