7.3 Viewing SSL VPN Statistics
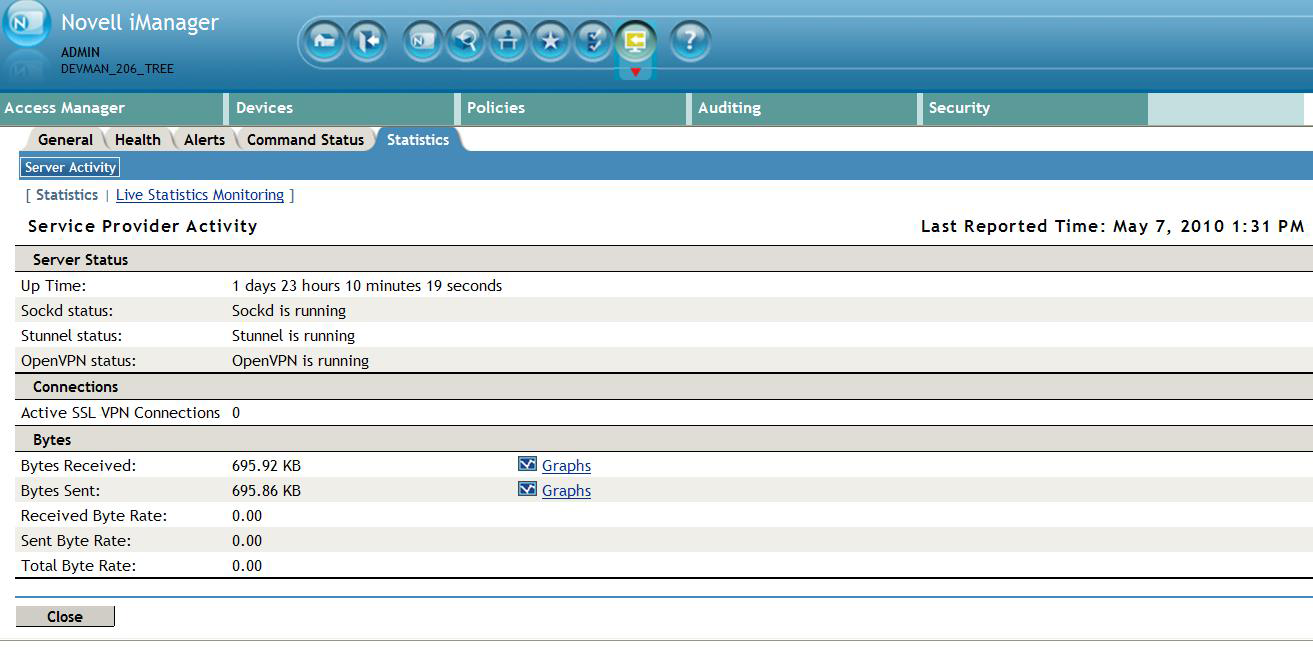
The Statistics page allows you to view information such as the number of active client connections and the time when the SSL VPN server was started.
7.3.1 Viewing the SSL VPN Server Statistics
-
In the Administration Console, click > [Server Name] > .

Server Status information is gathered in the following sections:
Connection information is gathered in the following sections:
Column
Description
Active SSL VPN Connections
Displays the number of active SSL VPN connections. Also displays the username, role of the user, and uptime of each user for each active connection.
Bytes information is gathered in the following sections:
Column
Description
Bytes Received
Displays the number of bytes received. You can also view a graph, which lists the number of bytes sent for fixed intervals. For more information, see Section 7.3.3, Viewing the Bytes Graphs.
Bytes Sent
Displays the number of bytes sent. You can also view a graph, which lists the number of bytes sent for fixed intervals. For more information, see Section 7.3.3, Viewing the Bytes Graphs.
Received Byte Rate
Displays the percentage of bytes received.
Sent Byte Rate
Displays the percentage of bytes sent.
Total Byte Rate
Displays the total percentage of bytes transferred.
-
Select one of the following options:
-
Statistics: To display the number of active client connections and the time when the server was started, click .
-
Live Statistics Monitoring: To refresh the statistics for a specified interval, click . You can select the refresh interval from the drop-down list.
-
-
Click to close the tab.
7.3.2 Viewing the SSL VPN Server Statistics for the Cluster
-
In the Administration Console, click > [Cluster Name] > .

-
The Statistics page has the following information:
Server Name: The IP address identifying the SSL VPNs in the cluster. Click the link to edit server information.
Statistics: Click the link to get a summary of the statistics of individual servers in a cluster. For more information on viewing the statistics details of individual servers, see Section 7.3, Viewing SSL VPN Statistics.
-
Click to close the tab.
7.3.3 Viewing the Bytes Graphs
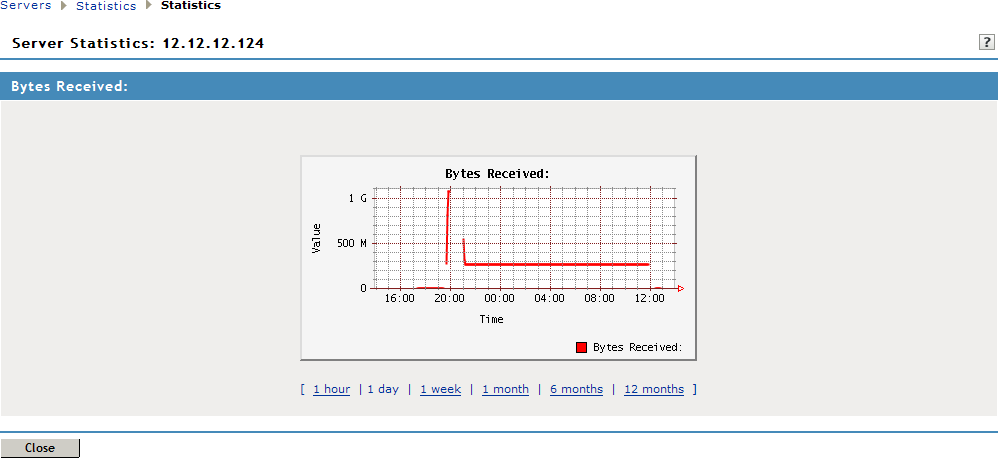
The number of bytes sent and bytes received can be viewed in the form of graphs. You can view graphs for the following time frames:
-
1 Hour: The number of bytes sent or received every ten minutes.
-
1 Day: The number of bytes sent or received every four hours.
-
1 Week: The number of bytes sent or received every day.
-
1 Month: The number of bytes sent or received every week.
-
6 Months: The number of bytes sent or received every month for six months.
-
12 Months: The number of bytes sent or received every month for one year.
To view graphs:
-
In the Administration Console, click > [Server Name] >
-
Select from either the or section, depending on your needs.

-
Click to close the Graphs page.