7.3 NCPTOP Quick Reference
You can monitor NCP Server connections, communications, volumes, and diagnostics by using NCPTOP. NCPTOP is a monitoring utility that looks like the NetWare Monitor utility, and is an interactive, real-time reporting utility. It is part of the novell-ncpserv RPM.
After NCP Server has been installed, you can start NCPTOP by entering ncptop at a terminal console prompt on the Linux server. Different statistic monitoring functions of NCPTOP can be accessed by using the function keys, or you can tab through the reports. The purpose of each function key and its options are displayed within the NCPTOP utility. Table 7-9 provides an overview of tasks available.
Table 7-9 NCPTOP Reports
|
Function Key |
Report |
Description |
|---|---|---|
|
F2 |
General |
Displays a general communications report for NCP Server. See Figure 7-1 for an example report. |
|
F3 |
Volume |
Lists NCP volumes, and allows you to get the following details for a volume:
|
|
F4 |
Connection |
Lists the current connections, and allows you to get details for each connection. |
|
F5 |
Diagnostics |
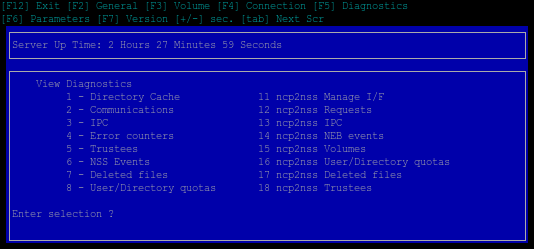
Lists further diagnostic options. See Figure 7-2 for an example report. |
|
F6 |
Parameters |
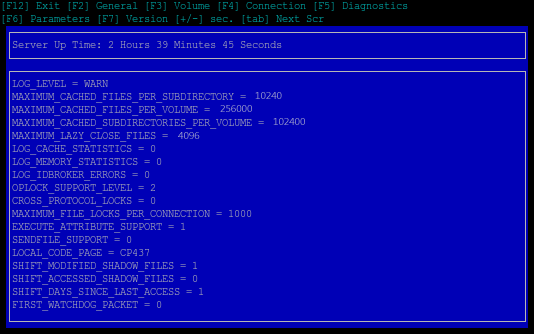
Displays the current settings for the NCPCON set parameters. See Figure 7-3 for an example report. For information about the parameters, see the Section A.2, NCPCON SET Parameters. |
|
F7 |
Version |
Reports the versions of the NCP Server software components. |
Figure 7-1 General Communications Report in NCPTOP

Figure 7-2 Diagnostic Reports List in NCPTOP

Figure 7-3 NCP Server Parameters Report in NCPTOP
