56.1 Using the GWIA Server Console
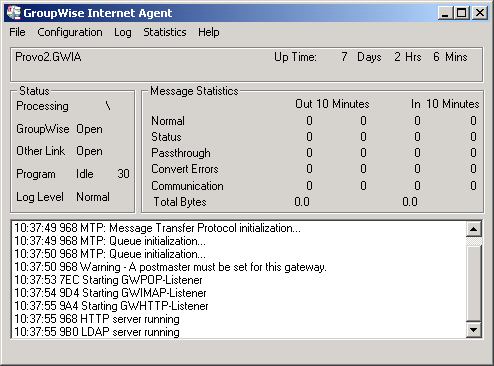
The GWIA console provides information, status, and message statistics about the GWIA to help you assess its current functioning.
|
Linux: |
You must use the --show startup switch in order to display the Linux GWIA server console. |
|
Windows: |
If the GWIA is running as a Windows service under the Local System User, it is displayed on the desktop only if the option was selected during installation or has been configured on the GWIA service’s General property page. |
Refer to the following sections for information about the specific sections and functionality included in the console:
56.1.1 Description
The description section of the console identifies the GWIA and displays how long its has been running.

Domain.Gateway: Displays the domain and GWIA names.
Up Time: Displays the total length of time the GWIA has been running. If the GWIA terminates unexpectedly (such as in a power outage), the display does not reset to 0 (zero). It shows the total time elapsed since the GWIA was last loaded after a proper termination.
Description: Displays any descriptive information provided on the GWIA object’s Identification page (GWIA object > ).
56.1.2 Status
The section of the console provides a quick look at the GWIA’s current message processing activity, network connectivity, and information logging level.

Processing: Displays a rotating bar if the GWIA is running. If there is no bar, or if the bar is stationary for more than one minute, the GWIA is not running.
GroupWise: Displays whether the GWIA’s network connection is OPEN or CLOSED. This network connection is the GWIA’s only link to GroupWise. The status indicates whether or not the GWIA can write to the wpcsin directory and access the wpcsout directory. The GWIA does a scan each cycle to see if these directories exist. If the status is CLOSED, the GWIA attempts to reattach to the network.
It is normal for this field to display the word CLOSED for a minute or so after you start the GWIA. However, if the connection remains CLOSED, look for the wpcsin and wpcsout directories. If they are not created yet, start the Message Transfer Agent (MTA).
Other Link: This field does not apply to the GWIA. It always says OPEN.
Program: Displays the processing cycle. You can use the Gateway Time Settings page (GWIA object > ) to adjust the processing cycle.
Log Level: Displays the logging level the GWIA is currently using. The logging level determines how much data is displayed on the message portion of this screen and written to the log file. You can use the console menu options to override the default setting for the current session. For information, see
56.1.3 Statistics
The section of the console can display five different sets of information:
Message Statistics
The section of the console, shown below, is the default statistics section displayed by the GWIA console.

shows the number of inbound and outbound messages processed by the GWIA. The and columns display the cumulative message totals and the column display snapshot totals for the last ten minutes. You change the time interval of the column in ConsoleOne. For instructions, see Section 57.2.2, Increasing Polling Time.
Normal: Displays the number of inbound and outbound messages processed by the GWIA.
Status: Displays the number of inbound and outbound status messages processed by the GWIA. The amount of status message traffic depends on the Outbound Status level (GWIA object > ). If the Outbound Status level is set to Full, more status messages are generated. If the Outbound Status level is set to Undelivered, fewer status messages are generated.
Passthrough: Displays the number of inbound and outbound passthrough messages the GWIA has processed.
Convert Errors: Outbound messages are converted from GroupWise format to MIME or RFC-822 format. Inbound messages are converted to GroupWise format. This field displays the number of inbound and outbound messages that the GWIA could not convert.
Communication: Displays the number of communication errors encountered by the GWIA.
Total Bytes: Displays the total number of bytes of inbound and outbound messages processed by the GWIA.
SMTP Service Statistics
The section, shown below, includes only the information for messages processed by the GWIA’s SMTP daemon.
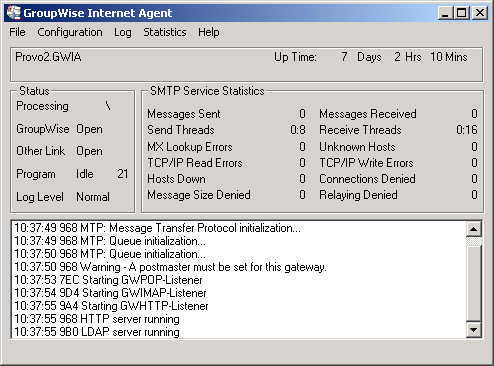
Messages Sent: Displays the total number of SMTP messages sent by the GWIA during its current up time.
Send Threads: The first number displays the number of threads currently being used to send SMTP messages. The second number displays the number of threads still available to the GWIA for sending SMTP messages. This is the total number of assigned send threads (by default, 8) minus the currently used threads. You can change the total number of assigned SMTP send threads in ConsoleOne (GWIA object > ). For more information, see Section 53.1.1, Configuring Basic SMTP/MIME Settings.
Messages Received: Displays the total number of SMTP messages received by the GWIA during its current up time.
Receive Threads: The first number is the number of threads currently being used to receive SMTP messages. The second number is the number of threads still available to the GWIA for receiving SMTP messages. This is the total number of assigned receive threads (by default, 16) minus the currently used threads. You can change the total number of assigned SMTP receive threads in ConsoleOne (GWIA object > ). For more information, see Section 53.1.1, Configuring Basic SMTP/MIME Settings.
MX Lookup Errors: To resolve hostnames to IP addresses, the GWIA performs MX record lookups in DNS. This field displays the number of MX record lookups that failed.
Unknown Hosts: Displays the number of SMTP hosts that the GWIA could not establish a connection with because the hostname could not be resolved to an IP address.
TCP/IP Read Errors: Displays the number of TCP read errors encountered by the GWIA. A TCP read error occurs if the GWIA connects successfully to another SMTP host but is unable to process a TCP read command during the message transfer.
TCP/IP Write Errors: Displays the number of TCP write errors encountered by the GWIA. A TCP write error occurs if the GWIA connects successfully to another SMTP host but is unable to process a TCP write command during the message transfer.
Hosts Down: Displays the number of SMTP hosts that the GWIA could not establish a connection with in order to send or receive messages. The GWIA was able to resolve the hostname to an IP address, but the connection could not be established.
Connections Denied: Displays the number of connections denied by the GWIA. A connection is denied if the host is blocked through:
-
A Class of Service (GWIA object > ). For more information, see Section 54.1, Controlling User Access to the Internet.
-
A blacklist (GWIA object > ). For more information, see Section 54.2, Blocking Unwanted Email from the Internet.
-
The Reject Mail if Sender’s Identity Cannot Be Verified setting (GWIA object > ), if it is enabled and the sender’s identity cannot be verified. For more information, see Section 54.2.4, Mailbomb (Spam) Protection.
Message Size Denied: Displays the number of SMTP messages that the GWIA did not send or receive because they exceeded the maximum message size. You can change the maximum message size in ConsoleOne (GWIA object > > edit class of service > tab or tab). For more information, see Section 54.1, Controlling User Access to the Internet.
Relaying Denied: Displays the number of relay messages denied by the GWIA. A relay message is denied for the following reasons:
-
The GWIA is not enabled as a relay host (GWIA object > ). For more information, see Section 53.1.8, Enabling SMTP Relaying.
-
The relay message could not be authenticated.
POP Service Statistics
The section, shown below, provides information about the POP activity handled by the GWIA.

Total Sessions: Displays the total number of POP3 sessions processed by the GWIA during its current up time.
Active Sessions: Displays the number of currently active POP3 sessions.
Idle Sessions: Displays the number of threads still available to the GWIA for POP3 sessions. This is the total number of assigned POP3 threads (by default, 10) minus the active sessions. You can change the total number of assigned POP3 threads in ConsoleOne (GWIA object > . For more information, see Section 53.2, Configuring POP3/IMAP4 Services.
Messages Sent: Displays the total number of GroupWise mailbox messages retrieved through POP3 sessions.
Normal Threads: Displays the number of POP threads that are busy and the number that are available.
Secure Threads: Displays the number of POP SSL threads that are busy and the number that are available.
Unknown Users: Displays the number of user logins that failed because the user does not exist in the GroupWise system.
Authentication Errors: Displays the number of GroupWise user logins that failed because the user supplied an incorrect password.
Retrieve Errors: Displays the number of errors generated because the GWIA could not transfer messages to the POP3 client.
Conversion Errors: Displays the number of errors generated because the GWIA could not convert retrieved GroupWise messages to MIME format.
TCP/IP Read Errors: Displays the number of TCP read errors encountered by the GWIA. A TCP read error occurs if the GWIA successfully opens a POP3 session but is unable to process a TCP read command during the session.
TCP/IP Write Errors: Displays the number of TCP write errors encountered by the GWIA. A TCP write error occurs if the GWIA successfully opens a POP3 session but is unable to process a TCP write command during the session.
Denied Access Count: Displays the number of POP3 sessions that were denied because the user does not have POP3 access. POP3 access is controlled through the user’s Class of Service assignment (GWIA object > ). For more information, see Section 54.1, Controlling User Access to the Internet.
Store Login Errors: Displays the number of GroupWise user logins that failed because the users’ GroupWise mailboxes were unavailable (for example, the post office is down or the GWIA link to the post office is down).
IMAP Service Statistics
The section, shown below, provides information about the IMAP activity handled by the GWIA.
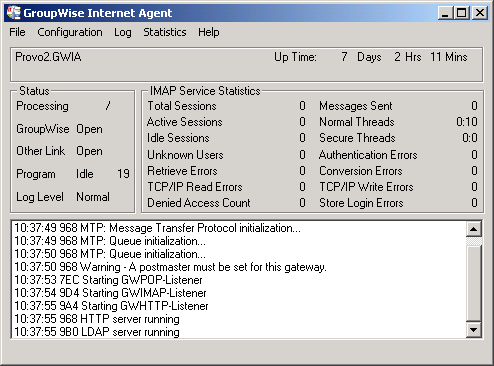
Total Sessions: Displays the total number of IMAP4 sessions processed by the GWIA during its current up time.
Active Sessions: Displays the number of currently active IMAP4 sessions.
Sessions Available: Displays the number of threads still available to the GWIA for IMAP4 sessions. This is the total number of assigned IMAP4 threads (by default, 10) minus the active sessions. You can change the total number of assigned IMAP4 threads in ConsoleOne (GWIA object > ). For more information, see Section 53.2, Configuring POP3/IMAP4 Services.
Messages Sent: Displays the total number of GroupWise mailbox messages retrieved through IMAP4 sessions.
Normal Threads: Displays the number of IMAP threads that are busy and the number that are available.
Secure Threads: Displays the number of IMAP SSL threads that are busy and the number that are available.
Unknown Users: Displays the number of user logins that failed because the user does not exist in the GroupWise system.
Authentication Errors: Displays the number of GroupWise user logins that failed because the user supplied an incorrect password.
Retrieve Errors: Displays the number of errors generated because the GWIA could not transfer messages to the IMAP4 client.
Conversion Errors: Displays the number of errors generated because the GWIA could not convert retrieved GroupWise messages to MIME format.
TCP/IP Read Errors: Displays the number of TCP read errors encountered by the GWIA. A TCP read error occurs if the GWIA successfully opens a IMAP4 session but is unable to process a TCP read command during the session.
TCP/IP Write Errors: Displays the number of TCP write errors encountered by the GWIA. A TCP write error occurs if the GWIA successfully opens an IMAP4 session but is unable to process a TCP write command during the session.
Denied Access Count: Displays the number of IMAP4 sessions that were denied because the user does not have IMAP4 access. IMAP4 access is controlled through the user’s Class of Service assignment (GWIA object > ). For more information, see Section 54.1, Controlling User Access to the Internet.
Store Login Errors: Displays the number of GroupWise user logins that failed because the users’ GroupWise mailboxes were unavailable (for example, the post office is down or the GWIA link to the post office is down).
LDAP Service Statistics
The section, shown below, provides information about the LDAP activity handled by the GWIA.
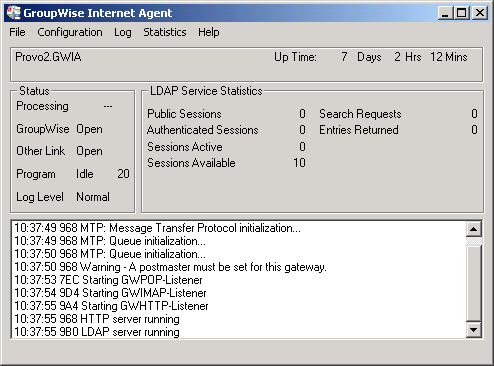
Public Sessions: Displays the total number of LDAP sessions handled by the GWIA.
Authenticated Sessions: This field is not used.
Sessions Active: Displays the total number of LDAP sessions currently being processed by the GWIA.
Sessions Available: Displays the number of threads still available to the GWIA for LDAP sessions. This is the total number of assigned LDAP threads (by default, 10) minus the active sessions. You can change the total number of assigned LDAP threads in ConsoleOne (GWIA object > ). For more information, see Section 53.3, Configuring LDAP Services.
Search Requests: Displays the total number of LDAP queries against the GroupWise Address Book.
Entries Returned: Displays the total number of Address Book entries returned for the search requests. For example, a single search request might return 25 entries.
56.1.4 Logging
The section of the console, shown below, displays GWIA activity. The number and detail of these messages depend on the logging level you select. See Section 56.6, Using GWIA Log Files for more information.

56.1.5 Menu Functions
The menu functions on the Linux and Windows GWIA console provide you with the following options.
File > Restart (F6): Select this option to restart the GWIA. The GWIA rereads all of its configuration files (gwia.cfg, blocked.txt, gwauth.cfg, route.cfg and so on).
File > Exit: Select this option to terminate the GWIA and return to the system prompt.
Configuration > Agent Settings: Select this option to display the GWIA configuration settings.
Configuration > Message Transfer Status: Select this option to display the status of the TCP/IP link between the GWIA and the MTA for the domain.
Configuration > Edit Startup File: Select this option to open the gwia.cfg file in the default text editor.
Log > Cycle Log: Select this option to close the current log file and start a new one.
Log > View Log: Select this option to view the log files.
Log > Log Settings: Select this option to set the logging level, turn on or off disk logging, and configure the maximum log file size and disk space. These changes apply only to the current session.
Statistics > Message: Select this option to display the Message statistics. For information about the Message statistics, see Message Statistics.
Statistics > SMTP Service: Select this option to display the SMTP Service statistics. For information about the SMTP Service statistics, see SMTP Service Statistics.
Statistics > POP Service: Select this option to display the POP Service statistics. For information about the POP Service statistics, see POP Service Statistics.
Statistics > IMAP Service: Select this option to display the IMAP Service statistics. For information about the IMAP Service statistics, see IMAP Service Statistics.
Statistics > LDAP Service: Select this option to display the LDAP Service statistics. For information about the LDAP Service statistics, see LDAP Service Statistics.
Statistics > Zero Statistics: Select this option to reset the Message, SMTP, POP, IMAP, and LDAP statistics.