9.1 Using the Exchange Gateway Server Console
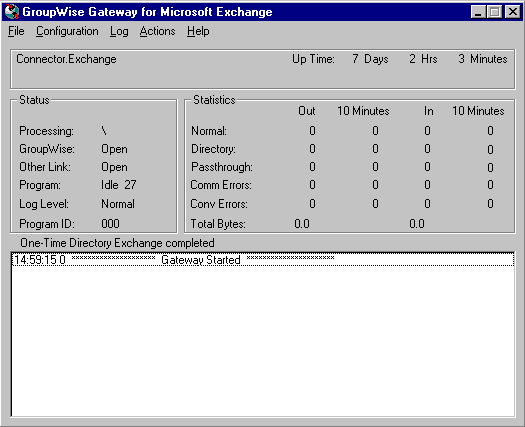
The Exchange Gateway server console displays the gateway’s activity when it is running as an application. If you run the Exchange Gateway as a Windows service, the server console does not appear and you must use other monitoring alternatives, as described in Section 9.2, Using the Exchange Gateway Web Console and Section 9.4, Using SNMP Monitoring Programs.
To properly administer the gateway as an application, you should understand the console and how it works. The screen is divided into various areas.

9.1.1 Information Box
The top portion of the console provides the following information about the gateway.
Domain.Gateway: The domain where the gateway is installed and the name of the gateway.
UpTime: The length of time the gateway has been running.
Description: The description you added when you configured the gateway, as described in Section 6.2, Providing Gateway Information.
9.1.2 Status Box
The Status box provides the following information:
Processing: If the gateway is running, this field displays a spinning bar. If there is no bar or if the bar is stationary for an extended period, the gateway is not running.
GroupWise: Whether the gateway’s network connection to the GroupWise domain is Open or Closed. It is normal for this field to briefly display Closed while the gateway is initializing. If the link shows Closed for an extended period, a network failure, insufficient access rights, or an error in setup fields could be the problem. Check for error messages in the Log Message box. For assistance resolving error messages, see Section A.0, Error and Informational Messages.
Other Link: The status of the gateway’s network connection to the Exchange system. Messages can be sent or received if Other Link is Open. If it is Closed, the network connection has been terminated. Check the status of the Exchange system.
Program: Where the gateway is in its current processing cycle (sending, receiving, or idle). You can use the Gateway Time Settings page in ConsoleOne to adjust the processing cycle. For more information, see Section 10.1, Adjusting the Gateway’s Send/Receive Cycle.
Log Level: The logging level the gateway is currently using. The level determines how much information is displayed in the Logging box and written to the log file. You can set the default logging level in ConsoleOne, as described in Section 9.3, Using Exchange Gateway Log Files. You can also change the log level for the current Exchange Gateway session, as described in Menu Summary.
9.1.3 Statistics Box
The Statistics box displays the amount of incoming and outgoing gateway traffic. The four columns display the cumulative totals and the snap shot totals. The four columns from left to right are: outgoing message totals, snap shot of outgoing messages (the default snap shot interval is 10 minutes), incoming message totals, and snap shot of incoming messages.
The snap shot interval statistic can help you get a more accurate picture of the amount of recent gateway traffic. For information about changing the snap shot interval, see Section 10.1, Adjusting the Gateway’s Send/Receive Cycle
The following types of status information are provided:
Normal: The number of normal incoming and outgoing messages the gateway has processed.
Status: The number of status messages the gateway has sent and received. The amount of status message traffic depends in part on the outbound status level of the gateway. An outbound status level set to Full causes more status messages than an outbound status level set to Undelivered. For more information about setting the outbound status level, see Section 8.7, Enabling Message Status for Sent Items.
Passthru: The number of incoming and outgoing passthrough messages the gateway has processed. Using the Exchange Gateway as a passthrough gateway between two GroupWise systems is not a recommended way to connect GroupWise systems. There are better alternatives currently available. See the GroupWise 6.5 Multi-System Administration Guide for preferred alternatives.
Conv Errors: The number of conversion errors for incoming and outgoing messages.
Comm Errors: The number of communications errors for incoming and outgoing messages.
Total Bytes: The total number of bytes for the incoming and outgoing messages.
9.1.4 Log Message Box
The Log Message box displays the Exchange Gateway’s activity. The amount and detail in this display depends on the logging level you select. For more information, see Section 9.3, Using Exchange Gateway Log Files.
For assistance with error messages that appear in the Log Message box, see Section A.0, Error and Informational Messages.
9.1.5 Menu Summary
At the top of the Exchange Gateway server console is a menu bar that provides the following functionality:
|
Menu |
Item |
Function Key |
Function |
|---|---|---|---|
|
File |
Exit |
F7 |
Stop the Exchange Gateway. |
|
Configuration |
Gateway Settings |
F5 |
Display the gateway configuration settings from the Exchange Gateway object in Novell® eDirectory™. For more information, see Section 6.0, Configuring the GroupWise Side of the Exchange Gateway and various sections in Section 7.0, Running the Exchange Gateway. |
|
Log |
View Log Files |
F9 |
Select a log file and view it in Notepad. See Section 9.3, Using Exchange Gateway Log Files. |
|
Log Settings |
F2 |
Override the default log settings for the current Exchange Gateway session. See Section 9.3, Using Exchange Gateway Log Files. |
|
|
Actions |
Zero Status |
F8 |
Reset all statistics to zero. |
|
Synchronize Directories |
Turn directory synchronization on or off. See Section 8.1, Enabling Directory Synchronization and Exchange of Address Books. |